Your basket is currently empty!
ProScern® DC-T Cell Proliferation Assays
ProScern® CFSE DC-T Cell Assays
the best way to compare whole protein antigenicity
The highly sensitive and versatile ProsScern® DC-T cell assay measures if candidate proteins induce helper CD4+ T cell proliferation that may lead to anti-drug antibody responses or other unwanted immunogenicity.
CD4+ T cell proliferation is measured by flow cytometry using CFSE dye dilution, a sensitive measure for cell proliferation.
Fully-formulated proteins are used in the assay, which gives an excellent in vitro comparison of the relative potential antigenicities of proteins.
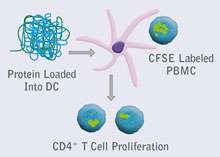
Figure 1. Outline of ProScern® CFSE DC-T Cell Assay. Dendritic cells are loaded with protein antigen of interest, then co-incubated with CFSE-labelled PBMCs. Cumulative T cell proliferation measured after 7 days.
Watch our presentation of the ProScern® CFSE DC-T Cell Assay technology
ProScern® DC-T Cell Assays for Whole Protein Immunogenicity Screening
The ProScern® Dendritic Cell (DC)-T cell assay for screening whole proteins has wide-ranging applications. It allows for an overall comparison of the T cell driven antigenicity of any number of drug candidates at a pre-clinical stage. Crucially it can also be used for assessing the impact on antigenicity of factors other than protein sequence. Such differences may include a comparison of biosimilars, protein modifications, degradation products, chemical entities given in combination therapies, and other parameters related to manufacturing processes, excipients, drug formulation and stability.
Additionally, in some cases it may not be possible to use the antigen to stimulate PBMC directly, particularly if the antigen involved modifies the function of responding T cells. To avoid such assay interference, antigens can be presented using dendritic cells, allowing the relative antigenicity of different leads to be compared directly.
ProScern® DC-T cell Assay Method Overview
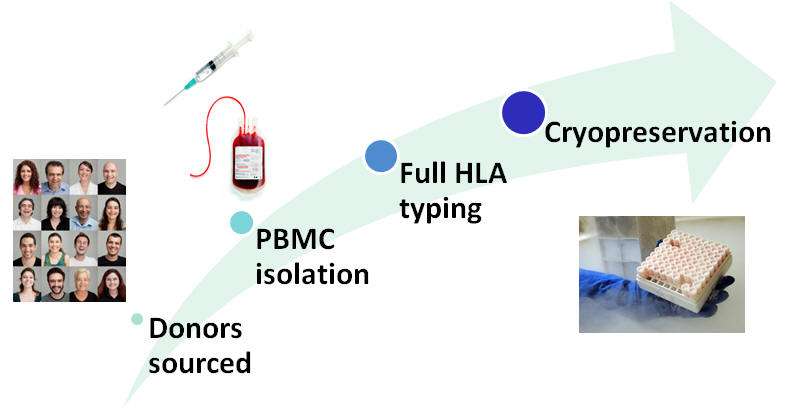
The assay uses samples from ProImmune’s bank of healthy high-resolution MHC Class II tissue-typed donor samples. A donor cohort can be selected to provide representative coverage of a particular population of interest, or to mimic the allele frequencies found in the global population. Typically a cohort of 40 to 50 donors is used, depending on the desired scale of the study.
Donor PBMC are used as a source of monocytes that are cultured in defined media to generate immature dendritic cells. Dendritic cells are loaded with test antigen (whole protein), and are then induced into a more mature phenotype by further culture in defined media. PBMC from the same donor sample are labeled with CFSE then cultured with the antigen-primed DCs for 7 days. Each DC-T cell culture includes a set of untreated control wells. The assay also incorporates reference antigen controls, comprising two potent whole protein antigens.
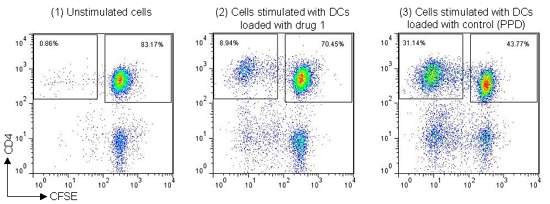
Figure 2: Example staining data from DC-T cell assay, (1) CFSE-labeled T cells incubated with DCs that were not co-cultured with antigen, (2) CFSE-labeled T cells incubated with DCs that had been previously co-cultured with whole protein antigen (Drug 1), (3) CFSE-labeled T cells incubated with DCs that had been previously co-cultured with control antigen (Tuberculin PPD).
Response Index for Evaluating Immunogenicity
When evaluating immunogenicity, it is appropriate to take account of the frequency of donor cell responses across the study cohort. A positive response (percentage stimulation above background > 0.5%) in 2 or more independent donor samples is considered indicative of a potential in vivo T cell response. It is also important to consider the strength of positive donor cell responses. This is determined by taking an average of the percentage stimulation above background obtained across accepted donors for each drug. A Response Index is calculated by multiplying the value of the strength of response by the frequency of the donors responding. This index is more representative of the level of immunogenicity than methods of analysis that rely on the frequency of response alone.
If a positive response is observed in a donor sample in either of the two T cell assays, then a proliferative immune response has been mounted through at least one of the six HLA class II alleles presented by that donor.
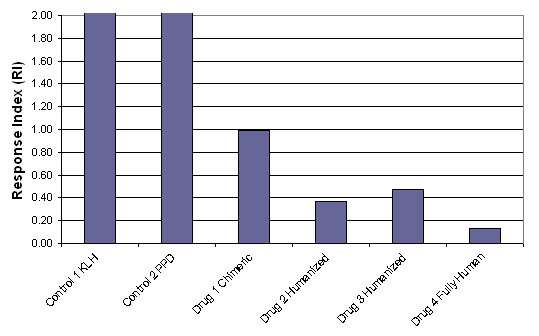
Figure 3: Results of a DC-T cell assay performed using 40 donors and 4 test proteins (in this case, therapeutic antibodies) and 2 controls.
As can be clearly demonstrated in figure 3, the fully human antibody drug 4 had the lowest response index, indicating the lowest in vitro immunogenicity in the ProScern® DC-T Cell Assay. As expected, the humanized antibodies (drug 2 and drug 3) showed the next lowest immunogenicity and the chimeric antibody (drug 1) showed the highest immunogenicity. Different therapeutic proteins will yield specific levels of immunogenicity and this can be directly quantified in the ProImmune DC-T cell assay.
The full length presentation can be viewed here
Key publications of ProScern® DC-T Cell Assay results
Steven et al., Front Immunol. (2017); 8: 1361. “In Vitro Maturation of a Humanized Shark VNAR Domain to Improve Its Biophysical Properties to Facilitate Clinical Development”.
doi:10.3389/fimmu.2017.01361
Figure 4: Proliferative DC-T cell assay response used to assess immunogenicity of monomeric VNAR proteins E06, BB10, BA11, BB11, and 2G. (C) Table of calculated response index values. Positive control antigens used for the assay were (i) Tuberculin purified protein derivative (PPD from Mycobacterium) at a final assay concentration of 5 µg/mL (70–100% of donors are expected to react to this protein) and (ii) keyhole limpet hemocyanin, a recognized highly immunogenic protein (adapted from original figure).
Jambari et al, PLoS One (2021) Apr 29;16(4). “Effect of O-linked glycosylation on the antigenicity, cellular uptake and trafficking in dendritic cells of recombinant Ber e 1”.
doi:10.1371/journal.pone.0249876
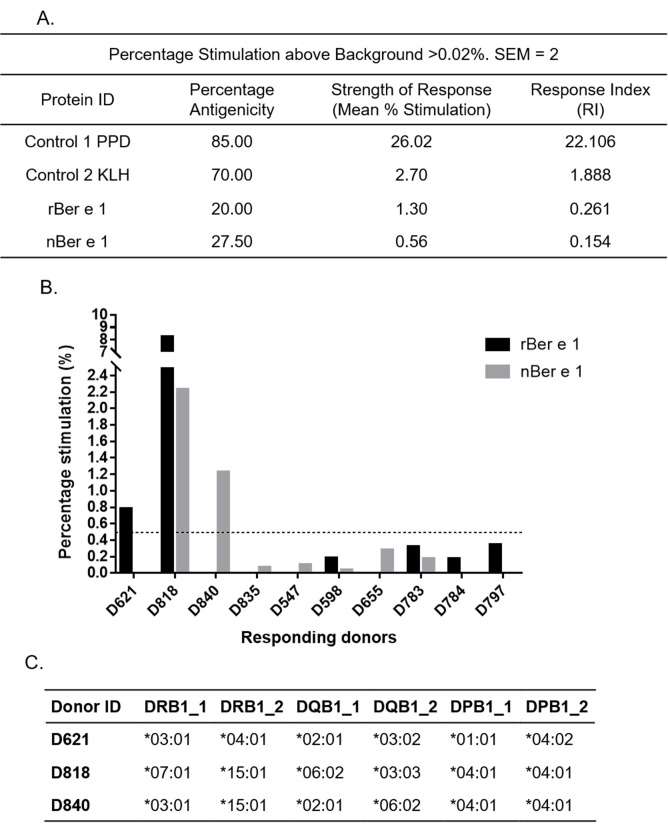
Figure 5: In vitro antigenicity of rBer e 1 and nBer e 1 by DC-T cell response assay. (A.) Response Index (RI) values for rBer e 1, nBer e 1 and reference protein from percentage antigenicity and stimulation data (percent stimulation above background ≥ 0.02%, SEM = 2) (B.) Graph of responding donors with percentage stimulation above 0.02% (SEM = 2) after stimulating with nBer e 1 and rBer e 1. Dotted line indicates higher stimulation cut-off of 0.5% (C.) Table of DRB1, DQB1, and DPB1 allele profiles of donors responding at the higher stimulation cut off of ≥0.5% (SEM = 2) when stimulated with rBer e 1 or nBer e 1. Percentage stimulation above this cut-off indicates a greater significance of antigenic response. (adapted from original figure)
ProImmune’s Expertise in Dendritic Cell culture
Through developing both our ProScern® DC-T cell proliferation assay and our ProPresent® Antigen Presentation Assay, we have considerable expertise in working with dendritic cells. If you require an assay that depends on these skills, then contact us to see if you could benefit from working with us: our Special Assay Service could be what makes the difference to your research program.